

TL;DR
- Observability helps teams understand why systems fail, not just detect failures
- It connects logs, metrics, and traces to provide full system visibility
- Essential for microservices, cloud-native, and distributed architectures
- Improves MTTR, reliability, and deployment confidence
- Goes beyond monitoring by enabling root cause analysis of unknown issues
Introduction: Why Observability Matters More Than Ever in 2026
Software systems have changed dramatically.
Today’s applications run across microservices, cloud platforms, containers, and third-party APIs. While this architecture enables faster innovation, it also introduces a new challenge: complexity.
When something breaks, the root cause is rarely obvious. A failure in one service can appear as an issue somewhere else entirely.
Traditional monitoring tools were designed for simpler systems. They can tell you when something is wrong, but they often fail to explain why.
This creates real problems for modern teams:
- Debugging takes longer than it should
- Engineers jump between multiple tools to find answers
- Releases become riskier as systems scale
Observability is now a core part of DevOps in software development, especially for teams managing modern cloud-native systems, helping them move from guesswork to clarity
What Is Observability in DevOps?
Observability in DevOps means being able to understand what is happening inside your system just by looking at the data it produces, like logs, metrics, and traces.
In simple terms, it answers one important question:
When something breaks, can you quickly figure out why it happened?
Think of your system like a car.
- Monitoring is like warning lights on the dashboard. It tells you something is wrong, like low fuel or engine trouble.
- Observability is like opening the hood and seeing exactly what caused the issue, whether it’s a leak, overheating, or a broken part.
This is why observability is so powerful.
Instead of just reacting to alerts, teams can:
- Investigate issues they did not expect
- Ask new questions when something unusual happens
- Debug problems without changing code or adding new tools
Simple Example
Imagine you run an e-commerce app.
One day, users complain that checkout is failing.
With only monitoring, you might see:
- Error rate is high
- Checkout service is down
But you still don’t know why.
With observability, you can:
- Check metrics to see when errors started
- Use traces to follow a checkout request step by step
- Look at logs to find the exact error message
You might discover:
👉 The payment service is slow because a third-party API is timing out
Now instead of guessing, you have a clear answer and can fix it quickly.
Why Observability Is Critical for Modern Systems
Modern systems are no longer simple or predictable. Because of this, teams need a completely different way to understand what is happening inside their applications.
Today’s applications are:
- Built using multiple small services instead of one large system
- Deployed across cloud platforms, sometimes spread across different providers
- Running on technologies like Kubernetes and serverless that scale automatically
This is why observability becomes even more important in cloud-native environments. In one hybrid cloud orchestration project, Creole Studios worked with AWS, Amazon EKS, AWS Lambda, GitHub Actions, AWS CDK, and Helm to modernize delivery for a growing platform. The project reduced deployment time by 70%, moving release cycles from around 2 hours to under 10 minutes, while preparing the architecture to support 10x traffic growth with zero infrastructure changes. For such systems, observability is essential because teams need visibility across containers, services, deployments, and infrastructure changes.
While this makes systems faster and more flexible, it also makes them harder to understand.
In these environments:
- A single user action, like placing an order, can go through many services
- Services depend on each other in ways that keep changing
- Failures do not always happen in obvious places
Simple Example
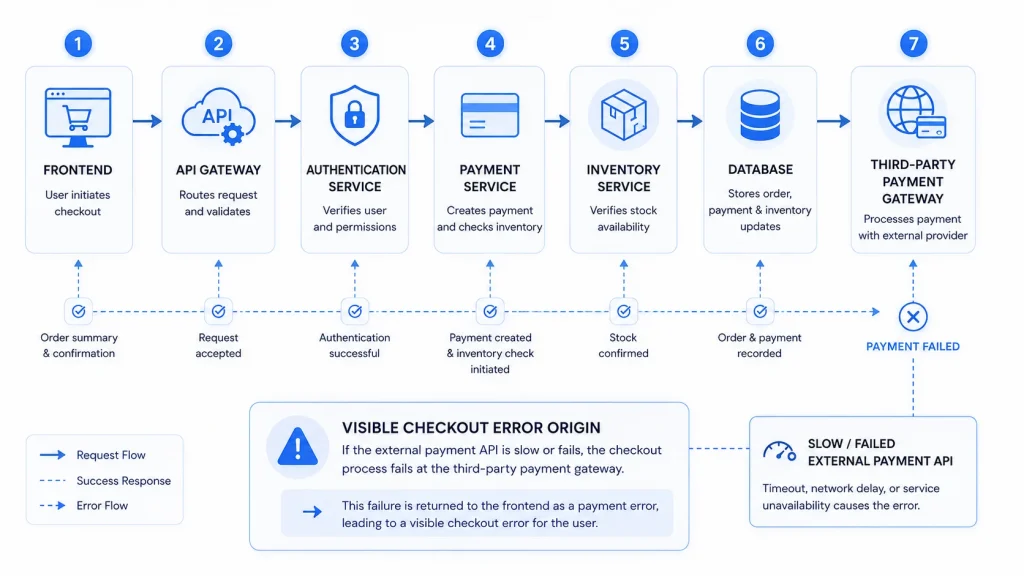
Let’s say a user clicks “Place Order” on your app.
Behind the scenes, this request might go through:
- Frontend → API → authentication service
- Payment service → inventory service → database
- Third-party payment gateway
If something fails, the issue might not be where it appears.
For example:
- The checkout page fails
- But the real problem is a slow third-party payment API
Without observability, teams would have to guess where the issue is.
Observability helps teams handle this complexity by:
- Finding issues they did not expect
- Tracking how requests move across services
- Understanding how one problem affects another part of the system
- Reducing guesswork during debugging
Instead of just reacting to alerts, teams gain a clear understanding of how their system behaves.
This is the key shift.
Traditional monitoring is reactive.
Observability is proactive.
It helps teams move from:
👉 “Something is broken”
to
👉 “We know exactly what is happening and why.”
Example: Tracing an Order Processing Request with OpenTelemetry
A distributed trace is made up of smaller units of work called spans. For example, when an order-processing request reaches the database, OpenTelemetry can create a span to track the operation, attach relevant context, and record any failure. The following simplified Python example demonstrates how this works.
from opentelemetry import trace
from opentelemetry.trace import Status, StatusCode
from opentelemetry.sdk.trace import TracerProvider
from opentelemetry.sdk.trace.export import (
    BatchSpanProcessor,
    ConsoleSpanExporter,
)

# Initialize the OpenTelemetry tracer
provider = TracerProvider()
processor = BatchSpanProcessor(ConsoleSpanExporter())
provider.add_span_processor(processor)
trace.set_tracer_provider(provider)
tracer = trace.get_tracer("order-processing-service")

def process_order(order_id):
    # This span represents one database-related operation in the trace
    with tracer.start_as_current_span("db_operation_process_order") as span:
        span.set_attribute("order.id", order_id)

        try:
            # Replace this with the actual database operation
            print(f"Processing order {order_id} in the database...")

        except Exception as error:
            span.record_exception(error)
            span.set_status(Status(StatusCode.ERROR))
            raise

process_order("ORD-9921")
The Core Pillars of Observability: Logs, Metrics, and Traces
Observability is built on three main types of data that help teams understand what is happening inside a system: logs, metrics, and traces.
You can think of them as three different ways of looking at the same problem.
- Logs tell you what happened
- Metrics show you how the system is performing
- Traces help you follow where the problem is happening
On their own, each one is useful. Together, they give you a much clearer picture.
Logs: Understanding What Happened
Logs are time-stamped records of events happening inside your system. They capture details about errors, transactions, and day-to-day system activity.
Logs can show things like:
- Error messages
- User actions
- Payment failures
- Database connection issues
- Login attempts
They are especially useful when you want to understand exactly what happened at a specific moment.
Simple example
Suppose a customer tries to make a payment, but the payment fails.
A log might show something like:
- “Payment request failed”
- “Database connection timed out”
- “Third-party API returned error 503”
This kind of detail is very helpful because it gives engineers the actual message behind the failure.
The problem is that logs can become overwhelming very quickly, especially in large systems. A modern app may generate thousands or even millions of log entries in a day. Without proper filtering, searching through logs can feel like looking for one important sentence in a huge pile of papers.
Metrics: Measuring System Performance
Metrics are numbers collected over time that show how your system is performing.
Common examples include:
- CPU usage
- Memory usage
- Number of requests per second
- Error rate
- Response time or latency
Metrics are useful because they give teams a quick, high-level view of system health. They make it easy to spot trends, compare performance over time, and trigger alerts when something goes outside the normal range.
Simple example
Imagine your website suddenly becomes slow.
Metrics might show:
- CPU usage jumped from 40% to 90%
- Response time increased from 200 ms to 2 seconds
- Error rate went up from 1% to 8%
This tells you that something is wrong and helps you notice when the issue started.
But metrics usually do not explain the full reason. They are great at showing that there is a problem, but not always why the problem happened.
Traces: Following the Request Journey
Traces help you follow a single request as it moves through different parts of your system.
This is especially useful in modern applications where one user action may involve many services working together.
Traces can show:
- Which services handled the request
- The order in which they were called
- How much time each service took
- Where delays or failures happened
Simple example
A user clicks “Checkout” in your app.
That one action may go through:
- Frontend
- API gateway
- Authentication service
- Payment service
- Inventory service
- Database
- Third-party payment provider
If the checkout is slow, a trace helps you follow that exact request from start to finish and identify where the delay happened.
For instance, the trace may show that:
- Frontend responded normally
- Inventory service was fast
- Payment service took 4 seconds because the external gateway was slow
Now the team knows exactly where to look.
How These Pillars Work Together
The real power of observability comes when logs, metrics, and traces are used together.
Each one answers a different part of the problem:
- Metrics tell you something is wrong
- Traces show where the issue is happening
- Logs explain why it happened
Simple example
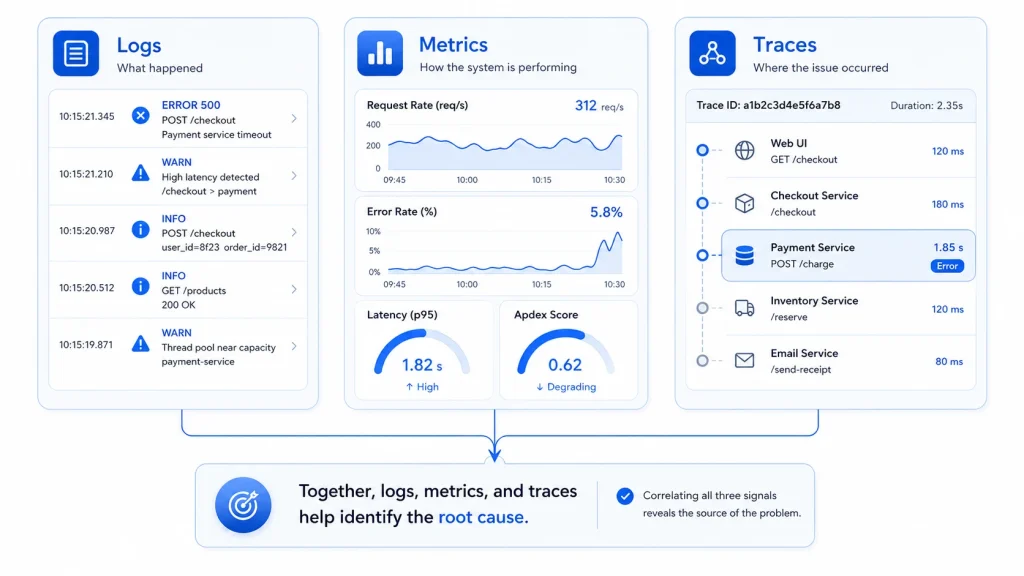
Let’s say users complain that checkout is failing.
Here is how the three pillars help:
- Metrics show that checkout errors increased sharply in the last 10 minutes
- Traces reveal that most failed requests are getting stuck in the payment service
- Logs show the exact error message from the payment gateway timeout
So instead of spending hours guessing, the team can quickly understand the issue and fix it faster.
That is why these three pillars matter so much. They work together to turn scattered system data into a clear explanation of what is happening inside your application.
Beyond the Three Pillars
Logs, metrics, and traces are the core of observability, but modern systems often need more context than these three signals alone can provide.
That is where additional signals become useful. They help teams understand what changed, who was affected, and how the issue impacted real users.
Some important examples include:
- Events: Show changes like deployments or configuration updates
- Real User Monitoring (RUM): Shows how users actually experience the app
- Profiling: Helps track CPU and memory behavior
- High-cardinality data: Gives detailed insights at user, session, or transaction level
- Semantic context: Adds useful metadata like service name, region, or environment
Simple example
Imagine your app starts slowing down after a new release.
- Metrics show response time increased
- Traces show the slowdown is in one service
- Logs show an error message
- Events reveal a deployment happened just before the issue started
This extra context helps teams find the root cause faster.
How Observability Works in DevOps
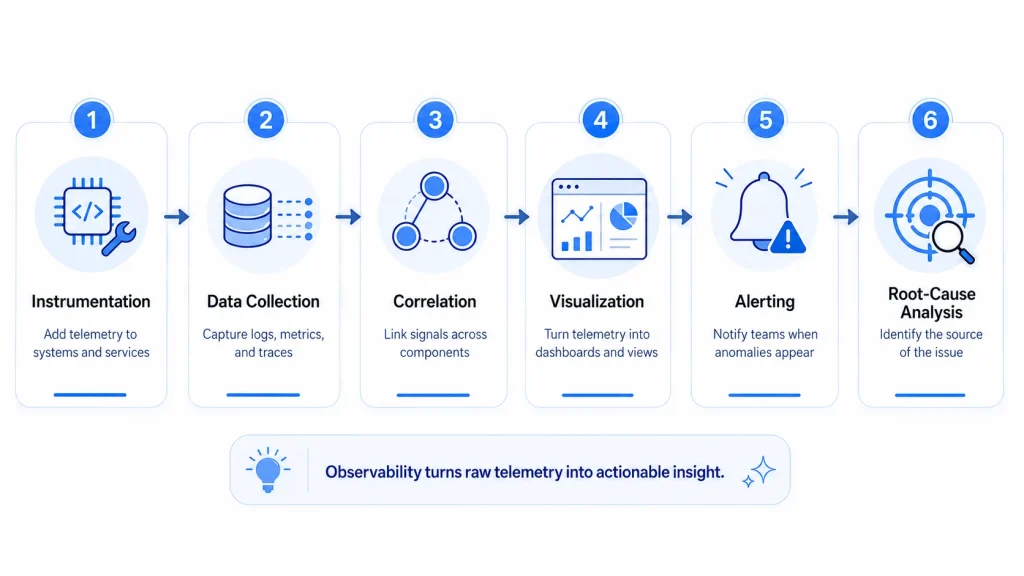
Observability works as a step-by-step process that helps teams turn system data into useful insights.
Here’s how it usually works:
1. Instrumentation
First, teams add instrumentation to their systems so they can collect logs, metrics, and traces.
2. Data Collection
This data is then gathered from applications, servers, containers, and other infrastructure.
3. Correlation
The next step is connecting different signals so teams can see how they relate to each other.
4. Visualization
Dashboards, charts, and service maps make the data easier to understand in real time.
5. Alerting
Teams set up alerts so they are notified when something important goes wrong.
6. Root Cause Analysis
Once an issue appears, teams use the connected data to find the exact cause faster.
Simple example
Suppose your app suddenly becomes slow.
- Metrics show response time has increased
- Traces show the slowdown is in the payment service
- Logs reveal a timeout error
- Dashboards help the team see when the issue started
- Alerts notify the team quickly
This workflow gives teams continuous visibility into the system and helps them solve problems faster.
Benefits of Observability for DevOps Teams
Faster Incident Resolution
- Reduce Mean Time to Resolution (MTTR)
- Quickly identify affected services
Proactive Issue Detection
- Detect anomalies before users are impacted
Better Collaboration
- Shared visibility across teams
- Reduced silos between development and operations
Reduced Engineering Toil
- Less time debugging
- More time building features
Improved Customer Experience
- Fewer outages
- Better performance and reliability
Observability also closely supports reliability goals that are often central to site reliability engineering, especially when teams need to balance speed with uptime.
How to Implement Observability in DevOps
Observability delivers the most value when teams follow a clear and practical approach instead of collecting random data from everywhere.
Here are the key steps:
Define SLOs and SLIs
Start by deciding what really matters to users, like uptime, response time, or error rate. This helps teams focus on the right signals instead of tracking everything.
Instrument Your Systems
Add logs, metrics, and traces to your applications and infrastructure so you can see what is happening inside the system.
Centralize Telemetry
Bring your observability data into one place as much as possible. This reduces tool fragmentation and makes investigation faster.
Correlate Data
Connect logs, metrics, and traces across services so teams can understand how one issue affects another part of the system.
Build Actionable Dashboards
Create dashboards that focus on important workflows and performance indicators, not just technical noise.
Integrate with CI/CD Pipelines
Use observability during deployments so teams can quickly spot if a new release introduces errors or performance issues.
Build an Observability Culture
Train teams to use observability properly and make it a normal part of development, deployment, and troubleshooting.
Simple example
Imagine your team releases a new checkout feature.
A good observability setup would:
- Track checkout success rate and response time
- Collect logs, metrics, and traces from the new service
- Show everything in one dashboard
- Alert the team if error rates rise after deployment
This way, observability becomes part of how the team builds and runs software, not just something they check after a problem happens.
This approach works best when combined with strong release practices like continuous development in DevOps, where fast feedback and small changes reduce the risk of production issues.
Common Challenges in Observability (and Solutions)
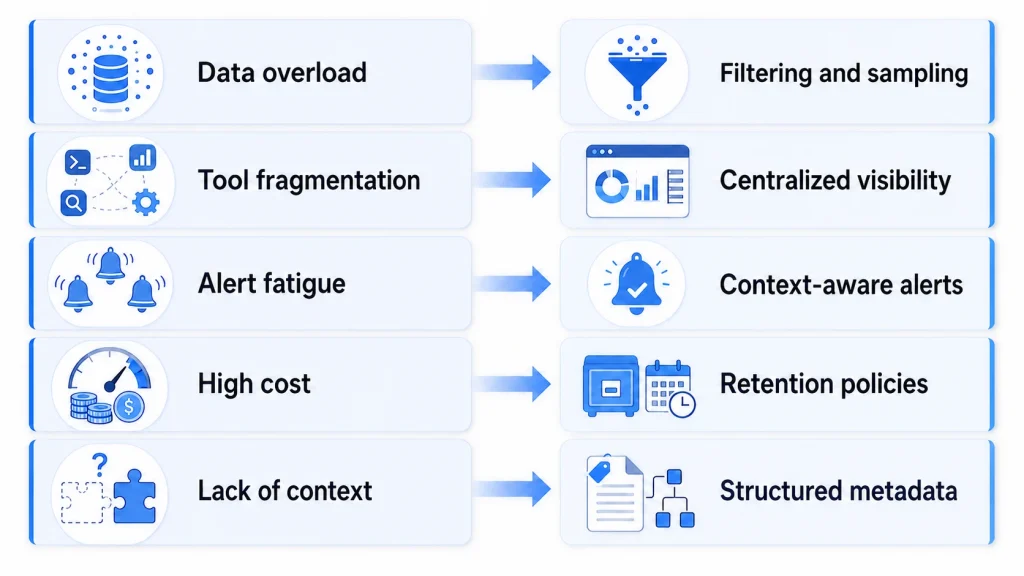
Data Overload
- Problem: Too much telemetry
- Solution: Sampling and filtering
Tool Fragmentation
- Problem: Multiple disconnected tools
- Solution: Unified observability platforms
Alert Fatigue
- Problem: Too many alerts
- Solution: Context-aware alerting
High Cost
- Problem: Data storage and processing costs
- Solution: Retention policies and optimization
Lack of Context
- Problem: Incomplete data
- Solution: Add metadata and structure
Future Trends in DevOps Observability
Observability is not static. As systems become more complex, observability is also evolving to become smarter and more business-focused.
Here are some key trends shaping its future:
AI-Driven Anomaly Detection
Instead of relying only on fixed thresholds, systems are starting to use AI to detect unusual patterns automatically. This helps teams catch issues earlier without manually setting alerts for everything. This trend is also part of the larger shift explained in how AI is transforming DevOps, where automation and intelligent systems are changing how teams detect, diagnose, and respond to issues.
Predictive Observability
Observability is moving from reacting to problems to predicting them. By analyzing past data, systems can warn teams about potential failures before they impact users.
Security Observability (DevSecOps)
Observability is increasingly being used for security. Teams can detect suspicious activity, unusual access patterns, or potential threats using the same data they already collect.
Unified Observability Platforms
More tools are bringing logs, metrics, and traces into a single platform. This reduces the need to switch between tools and makes troubleshooting faster and simpler.
Business Observability
Observability is expanding beyond technical metrics. Teams are now connecting system performance to business outcomes like revenue, user experience, and conversion rates.
Conclusion: Observability Is No Longer Optional
Modern systems are too complex for traditional monitoring alone.
Observability gives teams the clarity they need to understand system behavior, resolve issues faster, and deliver reliable software at scale. It helps move from guesswork to confidence, especially in cloud-native and distributed environments.
For growing businesses, this is not just a technical upgrade. It is a critical capability for scaling products, improving user experience, and reducing downtime.
If you are looking to implement observability effectively, it often requires the right expertise and execution strategy. This is where it makes sense to hire DevOps engineers who understand modern architectures, tooling, and best practices.
With the right team in place, observability becomes more than just visibility. It becomes a foundation for faster releases, better performance, and long-term growth.
FAQs
What is observability in DevOps in simple terms?
Observability in DevOps means understanding what is happening inside your system by analyzing its data, such as logs, metrics, and traces. It helps teams quickly identify why something broke instead of just knowing that it broke.
How is observability different from monitoring?
Monitoring tells you when something is wrong based on predefined alerts, like high CPU usage or downtime. Observability goes deeper and helps you understand why the issue happened, even if it was not expected.
Why is observability important for microservices architecture?
In microservices, a single request can pass through multiple services and dependencies. Observability helps track that entire journey, making it easier to find bottlenecks, identify failures, and understand how services interact with each other.
What are the three pillars of observability?
The three pillars of observability are:
- Logs, which show what happened
- Metrics, which show system performance over time
- Traces, which show how requests move across services
Together, they help teams detect, investigate, and resolve issues faster.
How does observability improve system reliability?
Observability improves reliability by helping teams detect issues early, understand root causes quickly, and fix problems before they impact users. It also enables proactive monitoring and better decision-making during deployments and scaling.


 30 mins free Consulting
 9 min read

 global


 Love we get from the world